


BNIM’s practice is rooted in the discovery of innovative solutions at varying scales of the built environment, including the rural landscape. Through critical analysis and continual evaluation, we apply data-driven solutions to complex challenges. Recently, we have employed this approach to conceptualize an implementable solution to solve one of today’s toughest challenges — the depletion of water quality.
Nutrient (pollution) reduction due to agricultural field runoff is a leading cause of dead zones in our rivers, lakes, and oceans. Broad nutrient reduction strategies have been attempted, but do not account for the drastic variation of terrain across the United States. Instead, what if a landowner could have the ability to tailor a personalized, site-specific solution that is completely different than a neighbor just a mile down the road?
Technology can facilitate this comprehensive, individualized solution in the form of a web-based mapping tool. This tool can pull from the following existing GIS databases:
– Land Use
– Waterways
– Topography/LiDAR
– Soil Type
– Drainage Tile
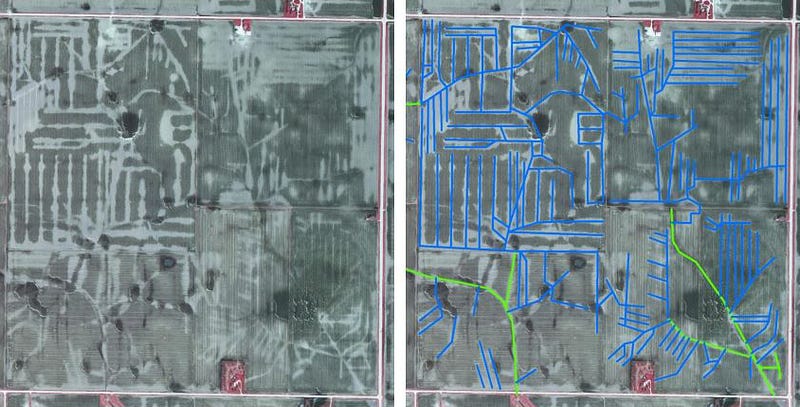 AGRICULTURE DRAINAGE TILE, INSTALLED PRIOR TO TILE MAPPING, CAN NOW BE MAPPED USING AERIAL PHOTOGRAPHY THAT IS PROPERLY TIMED AS LARGE WATERSHEDS DRAIN FOLLOWING HEAVY RAINS.
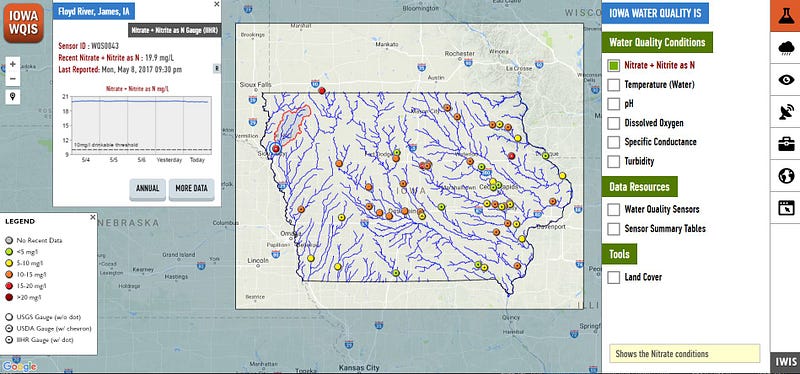
Access to landscape characteristics is further enhanced by ongoing water quality research. The University of Iowa, in particular, maps the real-time pollution levels of Iowa’s rivers through a vast network of sensors. This data provides a proactive opportunity to identify and address problem areas upstream, and then monitor the same water downstream in order to determine the effectiveness of pollution prevention methods.
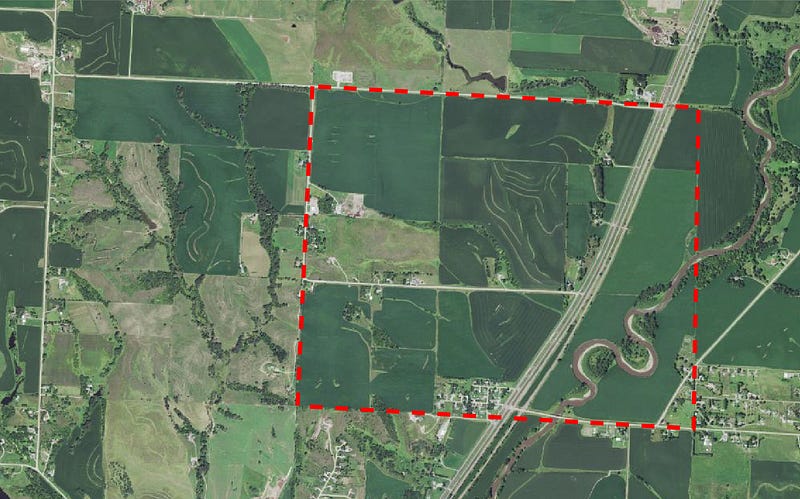
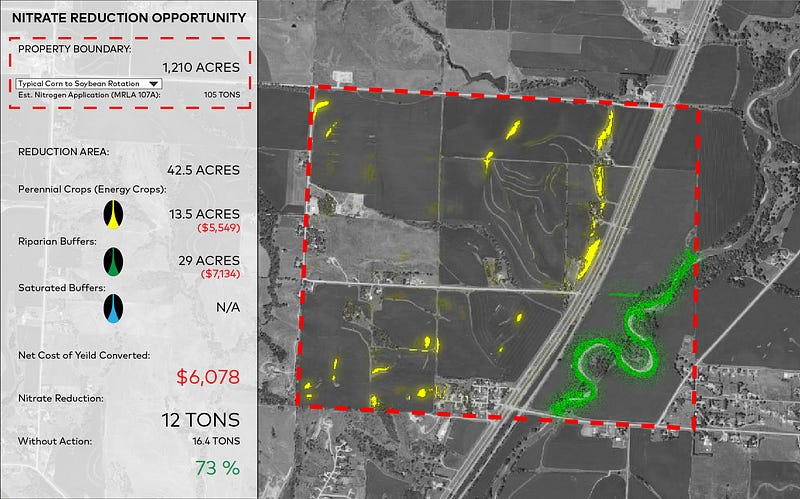
A mapping tool, using the research and databases identified above, provides the missing link between the general solution and the specific implementation. This tool can efficiently calculate the amount and location of land area to devote to nutrient reduction strategies. When further informed by regional averages for fertilizer, yield, and crop prices per acre, it can even efficiently identify acres to remove from production and strategies to implement in those locations (i.e., energy crops, riparian buffers).
With limited natural resource budgets nationwide, we must be efficient in allocating funds and land use to create nutrient reduction strategies. A single, broad strategy will not solve the problem. Thoughtful, data-driven strategies will create the catalytic change needed to transform our waterways.